Partial Dependence and ALE
Partial dependence plots
A partial dependence plot (PDP) shows the marginal effect of one or two features on a model's predictions:
- Pick the feature of interest.
- For each value of it on a grid:
- Set that feature to the value in every row of the dataset, leaving the other features as they are.
- Predict on the modified dataset and average the predictions.
- Plot the grid values against those averages.
A PDP shows whether the relationship is linear, monotonic or something more complex. Applied to a linear regression, it is always a straight line. For a classifier that outputs probabilities, it shows the probability of one class; with several classes, draw one line or plot per class.
PartialDependenceDisplay.from_estimator(
    rf, X_train, features=X_train.columns, kind="average", categorical_features=categorical_columns
)
On the Titanic random forest:
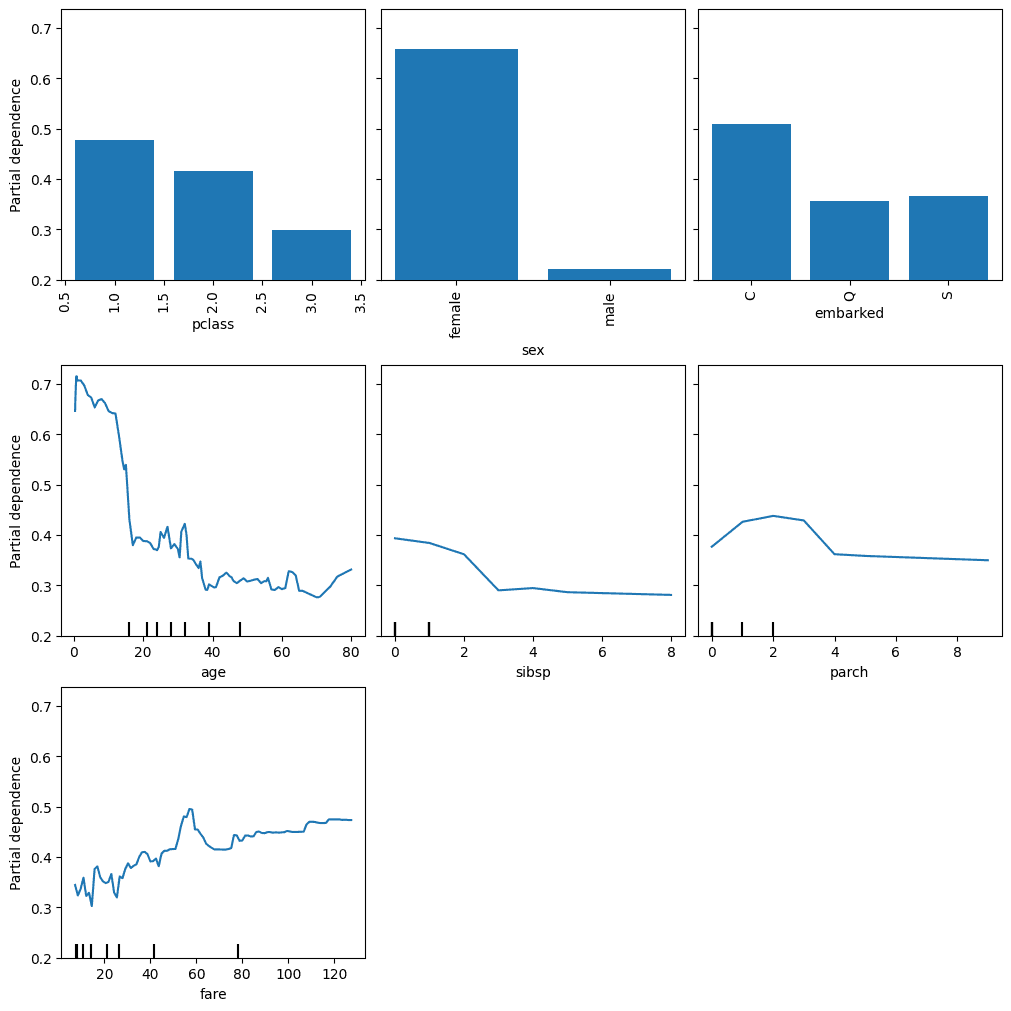
The weakness is step 2.1. It assumes the feature is independent of the others. If it isn't, setting it to every value in every row creates combinations that are unlikely or impossible, such as a third-class passenger paying a first-class fare, and the average includes the model's predictions on those made-up rows.
Accumulated local effects
Accumulated local effects (ALE) plots avoid that. Instead of overwriting the feature everywhere, ALE splits its range into intervals and, within each interval, only uses the rows whose value already falls there. For those rows it computes how much the prediction changes when the feature moves from the interval's lower edge to its upper edge, averages those changes, and accumulates them across intervals. Because each row is only moved a short distance, the predictions stay close to the real data. The result is centred so the average effect is zero.
ALE is also cheaper to compute than PDP. Molnar's Interpretable Machine Learning is the best introduction.
Using PyALE on the same data (with incomplete rows dropped):
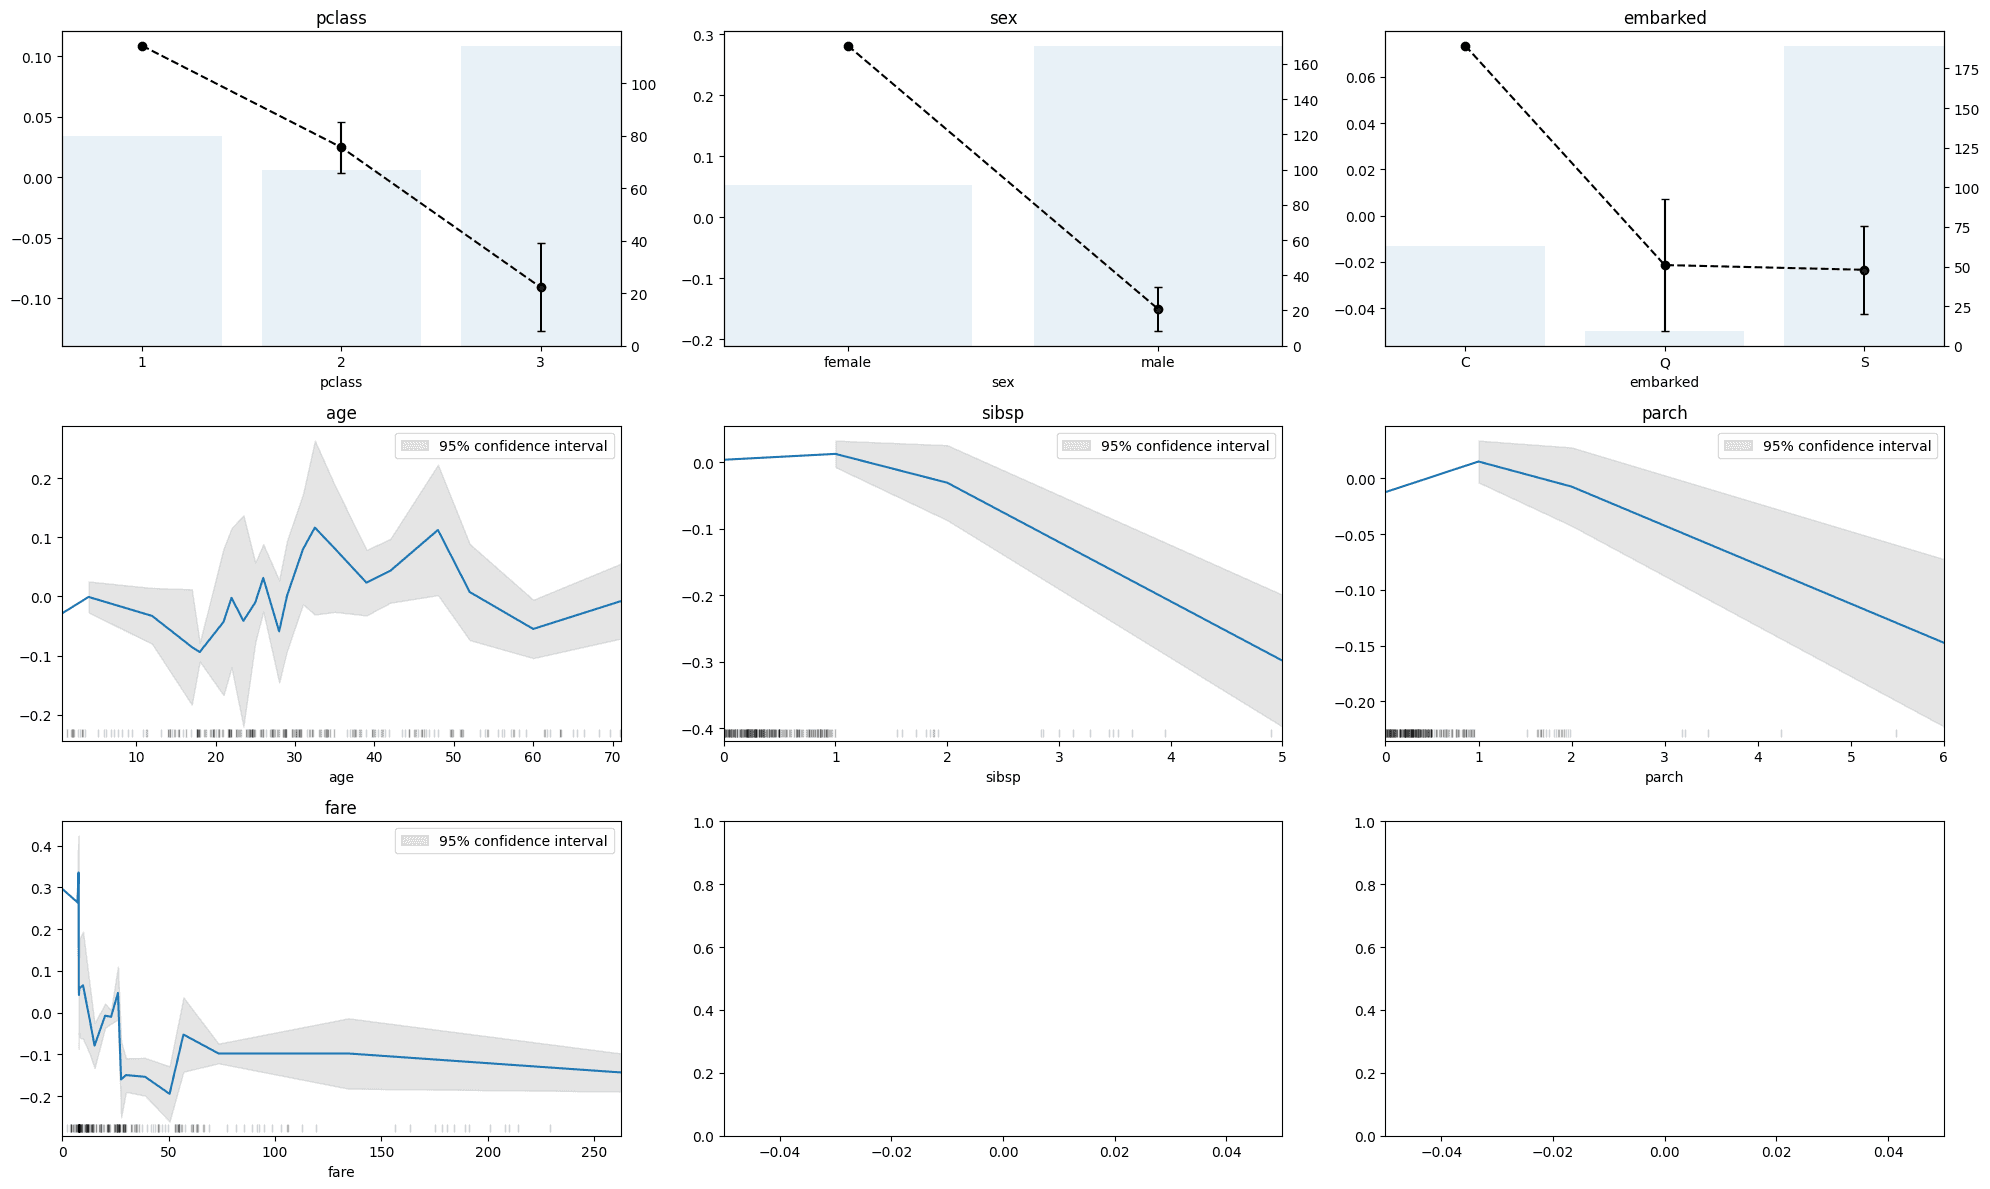
Sex and class tell the same story in both. Fare does not: the PDP has survival rising with fare, while the ALE effect falls after the cheapest fares. Fare is strongly tied to class, which is exactly the situation where PDP's independence assumption breaks. The two models were also fitted on slightly different rows, though, so that is a lead to follow up rather than a conclusion.
Original PDP notebook · Original ALE notebook
Revision log
- Merged the partial dependence and ALE notebooks from data-science-notes
Tags: Machine Learning