Profit Curves
A classifier gives probabilities; a business needs decisions. A profit curve picks the decision threshold by what each kind of right and wrong answer is worth, instead of by accuracy.
Example: who gets a retention discount?
The data is the Telco Customer Churn dataset, where the target is whether a customer leaves. An XGBoost classifier scores a ROC AUC of 0.815 on the test set.
Choosing a threshold from the distribution of predictions alone is not obvious. Confusion matrices at several thresholds show the trade-off, but not which side of it to prefer.
The payoff matrix
A payoff matrix puts a value on each cell of the confusion matrix. Suppose a discount offered to a customer who would have churned keeps them, which is worth £200, and a discount offered to one who would have stayed anyway is £80 wasted. Not offering a discount costs nothing either way.
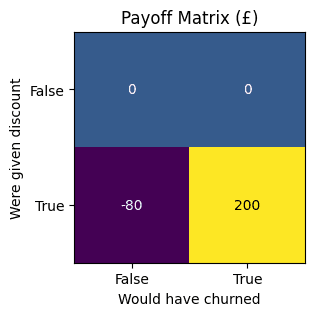
At a threshold of 0.5 the model correctly targets 189 churners and wrongly targets 179 non-churners, so
of value on the test set.
The profit curve
Was 0.5 the best threshold? Compute the profit at every threshold:
def profit_curve(y_true, y_pred, payoff_matrix, n_points: int = 101):
    thresholds = np.linspace(0, 1, n_points)
    profits = []
    for threshold in thresholds:
        cm = confusion_matrix(y_true, (y_pred >= threshold).astype(int))
        profits.append((cm * payoff_matrix.T).sum())
    return thresholds, profits
The best threshold is 0.22, which makes £32,360: about 38% more than at 0.5. Because a retained churner is worth far more than a wasted discount costs, it pays to cast the net wide.
Comparing models
The profit curve also compares models in money rather than metrics. Suppose a broken pipeline loses the Contract column and we retrain without it:
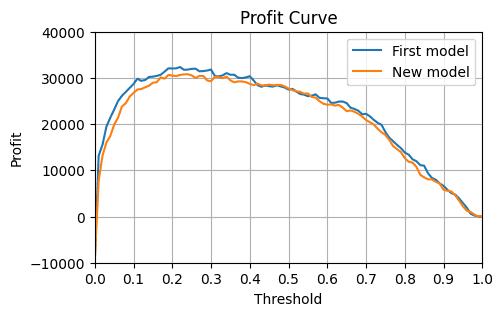
The new model's best profit is £30,800 at a threshold of 0.24, so losing that field costs £1,560 on this test set.
Limitations
- It is only as good as the payoff matrix. Meaningless payoffs give a meaningless curve.
- It assumes all customers are worth about the same.
- It applies to classification decisions like churn / no churn. For continuous decisions, see Continuous Outcomes.
Different thresholds for different customers
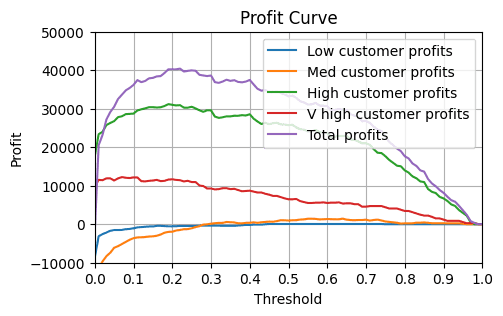
When some customers are worth much more than others, it makes sense to target them more aggressively. Suppose keeping a customer is worth three times their monthly charge, while a wasted discount still costs £80. Split customers into four bands by monthly charge (up to £20, £20 to £60, £60 to £100, over £100), give each band a payoff matrix based on its average charge, and find each band's best threshold:
| Band | Best threshold |
|---|---|
| Low | 0.45 |
| Medium | 0.64 |
| High | 0.19 |
| Very high | 0.07 |
The highest-value customers get the lowest thresholds, since losing them costs the most. (The medium band is an exception, worth a closer look.) Using per-band thresholds totals £44,919.
The original notebook compared that with the £32,360 from a single threshold, but the two use different payoffs: £200 per retained customer in one case, three times the monthly charge in the other. The fair comparison is with the best single threshold under the per-band payoffs, which is the peak of the total curve above. Per-band thresholds can never do worse than that, and the gap is the real value of segmenting.
Adapted from Dan Becker's Machine Learning for Business Decision Optimization course.
Linked from
Revision log
- Migrated from data-science-notes; fixed the payoff sum and qualified the per-group comparison
Tags: Machine Learning, Decision Optimisation